
Sesión 1 sobre el uso de Medios Sociales en la Docencia Universitaria @alfredovela @virtualf7_0

|
Scooped by Alfredo Corell |

No comment yet.
Sign up to comment
Get Started for FREE
Sign up with Facebook Sign up with X
I don't have a Facebook or a X account


 Your new post is loading...
 Your new post is loading...
Your new post is loading...
Sesión 1 sobre el uso de Medios Sociales en la Docencia Universitaria @alfredovela @virtualf7_0
No comment yet.
Sign up to comment
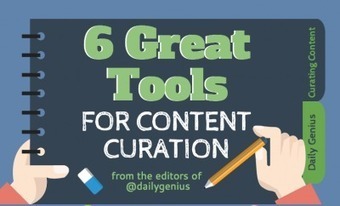
"I read recently that content curation is dead. I have a few different arguments against this concept, but for now, I’ll keep it short and sweet: Content curation is not dead, and while the debate over curating content online vs creating new content will rage on and on, curating content for other reasons is still going strong. That said, there are a lot of different ways to go about content curation, so we’ve test driven a few different tools so you can figure out which might work best for you whether you’re curating content for work projects, assigning it as a school project, for your own professional development, or personal interests." Via John Evans

magnus sandberg's curator insight,
October 6, 2014 3:31 AM
I'm rescooping this for three reasons. First, the term "curation" is fairly new to me and it is nice to see how different forms it can take. Secondly, I read so many blogposts entitled "10 tools for this" or "35 reasons for that". It is nice too see one of those where all of the 6 tools are actually great. Third, the fact that I actually have experience with three of the six tools makes me feel good. So enjoy :)
Una presentación con 16 herramientas online gratuitas para crear infografías.
Alfredo Corell's insight:
Una selección de herramientas gratuitas online para crear infografías. Algunas tienen opciones de pago para herramientas avanzadas
From
imgur

Imgur is home to the web's most popular image content, curated in real time by a dedicated community through commenting, voting and sharing. Via Dr. Susan Bainbridge
Una presentación sobre Infografías: o cómo hacer marketing de alto impacto.
Alfredo Corell's insight:
Se echa de menos que Alfredo, un gran profesional en infografías... nos de unas pinceladas sobre su uso educativo (no solo para márketing empresarial).
Here are five free tools that your students can use to create infographics.
Alfredo Corell's insight:
A recent review by the always direct to the point Richard Byrne. Some of the tools, old in the media... but a nice and useful review.
Thanks to Carole DEBONT for the suggestion
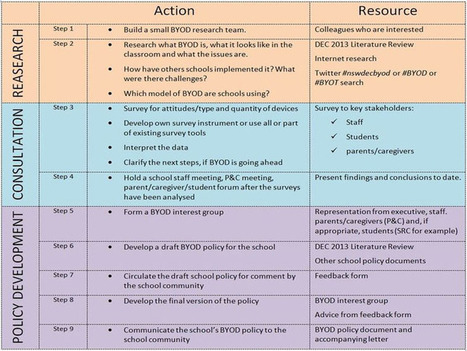
9 Steps For Schools To Create Their Own BYOD Policy (RT @TeachThought: 9 Steps For Schools To Create Their Own BYOD Policy http://t.co/WGSZKJBSN2 @BrendaWocsb)...
Alfredo Corell's insight:
simple and useful infographics about BYOD policy in the classroom

Alfredo Corell's insight:
You don't need to be a programmer, a designer, or a data analyst. Heck, you don't even need a tutorial. Drag and drop, rock and roll. Combine text, charts and interactive filters into living narratives. Let your readers deep dive into the parts of the dataset that mean the most to them.

Taryn Coxall's curator insight,
October 15, 2013 8:17 PM
"Infoactive" is a simple and interactive resource, suitable for both teachers and the upper primary student. this enagaging website allows users to create andmost importantly share viual stories. It allows the audience/ the reader to explore their ideas through a collaboration of images, videos, audio and text. perfect for the modern day classroom teacher, this website is sure to engage students by placing a fun, interesting and interactive vibe on a average lesson in the classroom.
Alfredo Corell's insight:
Video de casi 15 minutos para explicar la fabricación de Infografías con Infogr.am. Es gratuita, sencillo y útil
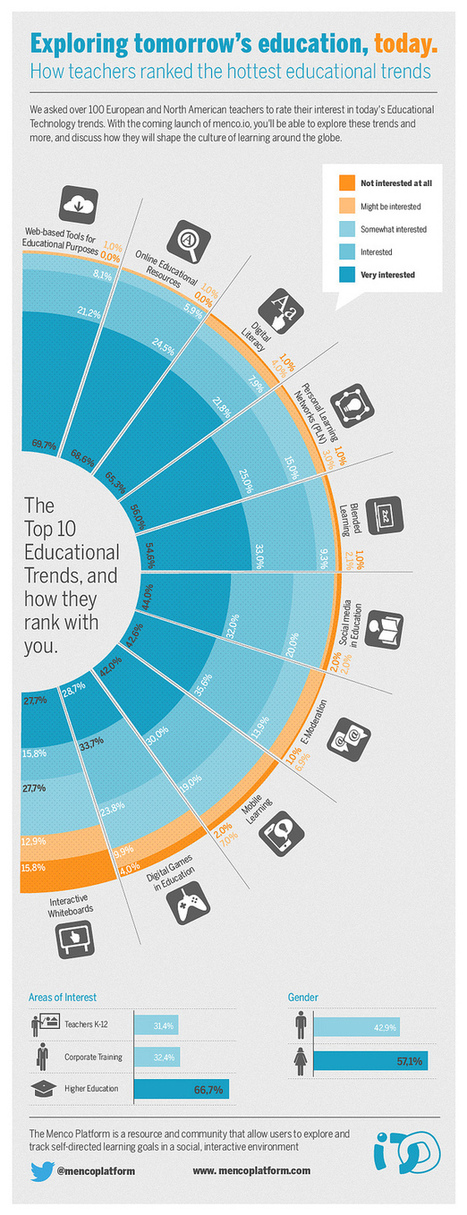
Teachers rate their interest in today’s Educational Technology trends. With the coming launch of menco.io, you’ll be able to explore these trends and more, and discuss how they will shape the culture of learning around the globe. Via Nik Peachey, Rosemary Tyrrell, Ed.D.
Alfredo Corell's insight:
OK, but... who did this study?

Ali Anani's curator insight,
September 10, 2013 12:16 AM
Exploration of the changing teaching landscape 
Alfredo Corell's comment,
January 26, 2015 9:16 AM
well... Elena, you are speaking about a 2013 post!!!!

Sarah E Kerr's curator insight,
June 2, 2016 4:35 AM
A fascinating snapshot of trends for ICT uses in teaching

Las visualizaciones gráficas son herramientas poderosas para mostrar conceptos e ideas. Son útiles para atrapar a los usuarios en un gráfico con la información que compilamos para elaborarla. La mayoría de ellas está pensada para transmitir contenido relevante. Via Cacho Mazzoni
Alfredo Corell's insight:
1-Piktochart
2-Visual.ly
3-Fluxvfx
4-Many Eyes
5-Vizualize.me
6-Infogr.am
7-Vizify
8-Photo Stats
9-Creately
10-Stat Planet
11-Hohli
12-Google Public Data Explorer
13-Tagxedo
14-Wordle
15-Cacoo
|
Una presentación sobre Diseño y uso docente de Materiales Multimedia (Infografías y screencasting).
Alfredo Corell's insight:
Hablar de Alfredo Vela es hablar de un valor en alza en el panorama de Innovación y TICs en Valladolid. Marca Personal Innovación Docente Infografías Social Media allá donde mires estará Alfredo... y esto no se consigue ni en 1 año ni con un ramillete de infografías. Por eso le hemos invitado como ponente a los cursos de formación del profesorado en la Universidad de Valladolid
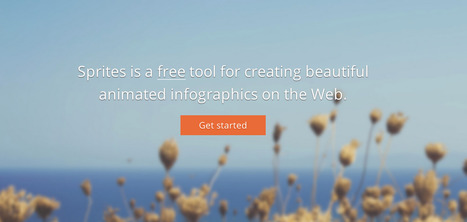
Sprites is a free tool for creating beautiful animated infographics for the Web. Via Ana Cristina Pratas
Alfredo Corell's insight:
Easy to Use With a good set of visual elements and built-in themes composing your infographic becomes super-easy. Free and Open The basic version of Sprites is absolutely free for everybody and all infographics are released under Creative Commons license. Embracing the Web Everything in Sprites is 100% HTML5-based and plugin-free. There's no Flash or any other proprietary technology used. Fully Scalable Sprites infographics utilize the newest responsive design techniques and should look good on pretty much any device. Mobile-Ready We try to make Sprites infographics shine on as many platforms as possible. You can already try it on your iPhone and iPad. Developer-Friendly The JavaScript SDK plus the guidelines on making your own themes are available atgithub.com/spritesapp.

Raluca Luana Gaiseanu's curator insight,
May 28, 2014 3:47 AM
Keep searching for a good free infographic tool, that will make my "life" easier. Today, Sprites is tested :) Brand new app, so let's criticize. :D
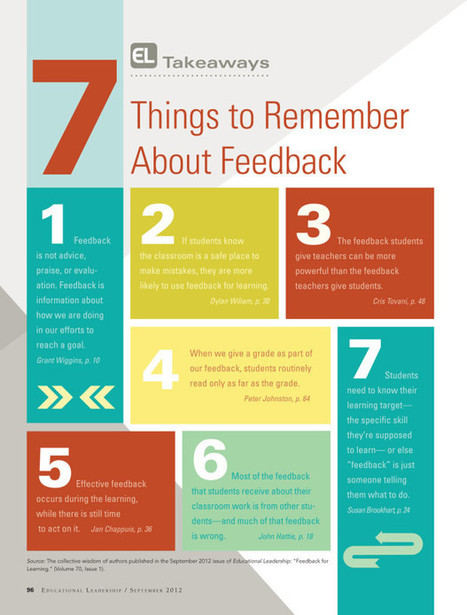
Feedback is an inevitable part of teaching. Naturally, you’re in a position where you’re giving a whole lot of feedback, but you’re likely on the receiving end of feedback as well.
Alfredo Corell's insight:
7 Things To Remember About Classroom Feedback

Infographics are popular. They’re a fun way to present and read data, and many people believe that information that is presented visually is often retained better (at least for some learners).
Alfredo Corell's insight:
Interactive infographics are really cool. They allow users to interact with the data – sometimes in a superficial way such as with mouse over or scrolling effects, or in a more meaningful way, where users can input their own data and the graphic becomes more personalized to their needs. That said, making an interactive infographic is more complicated than making a static infographic, and most people will assume that creating interactive infographics is way above their technological expertise (or at least will require more time than they can devote to it).
Vivimos en un mundo donde la información rápida y gratuita se encuentra a sólo unos clics de distancia. Aunque esto parece ser algo bueno, el problema aparece cuando se quiere interpretar la gran cantidad de datos disponibles a nuestro alrededor.
Alfredo Corell's insight:
hay 7 consejos clave para crear sus propias infografías: 1. Haga un plan2. Agregue valor primero; estética después3. Cuente una historia4. Sea un gran diseñador … O busque uno. 5. Use la teoría del color6. Pida una opinión7. Hágala fácil de compartir
![Is Mobile Learning in our DNA? [INFOGRAPHIC] | LearnDash | Create, Innovate & Evaluate in Higher Education | Scoop.it](https://img.scoop.it/bCEjNCpS9RTk6Z1CtbRl8Tl72eJkfbmt4t8yenImKBVvK0kTmF0xjctABnaLJIm9)
Mobile learning is an exciting concept across many industries, however for future generations it will be the expectation. In fact, the young people of today have never known a world without internet, laptops, iPads and the like.
Alfredo Corell's insight:
While there is still a large population who are part of the “digital divide” (i.e. people that can remember life before internet and digital technologies), the up-and-coming generation appears to have mobile learning as very much part of their psyche. For more interesting facts related to mobile learning, take a look at the infographic below.

Recently, the Babson Survey Research Group and Pearson conducted a survey of nearly 8,000 faculty members in higher education to find out more about how faculty are using social media.
Alfredo Corell's insight:
While it seems that most faculty have adopted some social media use in their personal life, fewer have done so professionally. And their feelings about using social media professionally (in and out of the classroom) seem to be pretty mixed. Keep reading to learn more (and you can access a larger pdf of the infographic by clicking here).
Alfredo Corell's insight:
A completely updated web app to create stunning infographics in few minutes!!! It deserves a visit. Thus, Have a go Of course... there's a "pro" option
Según la Wikipedia una infografía es una representación visual de información “en la que intervienen descripciones, narraciones o interpretaciones, presentadas de manera gráfica normalmente figurativa, que pueden o no coincidir con grafismos abstractos y/o sonidos”. Las infografías nos facilitan el acceso a información compleja, normalmente en la que aparecen datos numéricos, mediante el uso de diagramas y otras representaciones gráficas y a menudo acompañadas de narrativa que ayuda a entender mejor el contexto en el que se dan esos datos. Via Mauricio M. Escudero
Alfredo Corell's insight:
Guía sencilla de cuestiones a tener en cuenta en la realización de una infografía. Con enlace final a proveedores gratuitos para realizarlas.
Does your learners prefer acquiring and processing information via images, pictures, maps, graphs, charts, illustrations, and other visual aids? Since they are Via Christopher Pappas, Maritza Pérez Hdez , juandoming, Silvano Poblano Morales
Alfredo Corell's insight:
Good review of Infographics tools

Maritza Pérez Hdez 's curator insight,
January 19, 2013 6:00 PM
Una buena herramienta para contar con los puntos claves para una lectura ágil, mejorar la comprensión lectora sobre un tema, propiciando un aprendizaje más visual y significativo. |


Presentación utilizada en la primera sesión del curso "Medios Sociales en Formación" para profesorado de la Universidad de Valladolid.
Se abordaron herramientas como: